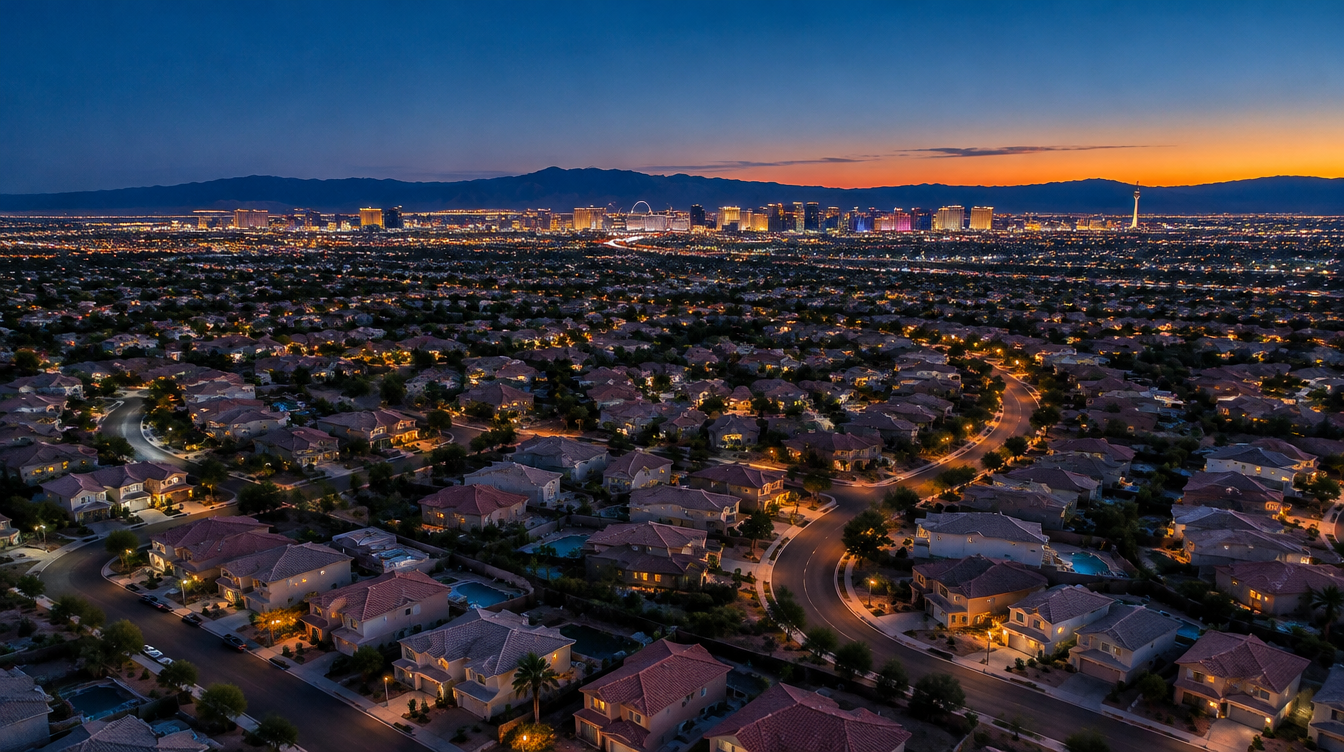
Aerial view of Las Vegas valley neighborhoods at blue hour

Las Vegas Short Sale Report, 2024 to 2026

We pulled every Las Vegas, Henderson and North Las Vegas short sale on the MLS that was active, under contract or sold between January 2024 and October 2026. That came to 511 homes. Then we went through the listing history on each one to see when the owner bought, what they paid, and what happened to the house after the sale.

The numbers at a glance

  • 245 short sales closed since January 2024, and 266 more are active or under contract today.
  • Closings doubled in spring 2026: 42 in the second quarter, the most of any quarter in this data.
  • 115 of the sellers bought in 2022. Only 7 bought in 2021.
  • The median short sale closed at 100% of its final list price and 96.8% of its original list price.
  • 36% of buyers paid cash, and 26 of these homes have already been renovated and resold.

2011 vs. today

In 2011, about 11,900 short sales closed in the Las Vegas MLS, close to 1,000 a month. In 2024 there were 90. Short sales are rising again, and they’re still about 1% of the 2011 pace.

Short sales closed: 2011 vs. todayClosed short sales per year, Las Vegas MLS
03,0006,0009,00012,00020112011: about 11,900 short sales closedabout 11,90020242024: 90 short sales closed9020252025: 64 short sales closed642026*2026*: 91 so far short sales closed91 so far

* 2026 through October 11. 2011 count covers the full Las Vegas MLS, mostly the valley plus Pahrump and outlying areas. 2024 to 2026 counts cover Las Vegas, Henderson and North Las Vegas. 2011 had about 130 times as many short sales as 2024.

Most of today’s short sale sellers bought between 2022 and 2025, near the top of the market. If that’s you, you’re part of a small group, and most of these gaps run tens of thousands of dollars. That leaves room to catch up, sell close to break-even, or work out a short sale with a lender that has seen very few of them.

Short sales are picking up again

Through 2024 and 2025, closings mostly ran between 12 and 22 a quarter, apart from a spike in spring 2024. In 2026 they jumped, and townhomes and condos made up a bigger share over the summer.

Short sale closings per quarterLas Vegas, Henderson and North Las Vegas, January 2024 through September 2026
01530452024 Q1: 11 single-family2024 Q1: 3 townhome or condo2024 Q1: 1 manufactured15Q120242024 Q2: 28 single-family2024 Q2: 7 townhome or condo35Q22024 Q3: 13 single-family2024 Q3: 4 townhome or condo2024 Q3: 1 manufactured18Q32024 Q4: 19 single-family2024 Q4: 2 townhome or condo2024 Q4: 1 manufactured22Q42025 Q1: 9 single-family2025 Q1: 6 townhome or condo2025 Q1: 2 manufactured17Q120252025 Q2: 16 single-family2025 Q2: 2 townhome or condo2025 Q2: 2 manufactured20Q22025 Q3: 11 single-family2025 Q3: 1 townhome or condo12Q32025 Q4: 10 single-family2025 Q4: 5 townhome or condo15Q42026 Q1: 13 single-family2026 Q1: 3 townhome or condo16Q120262026 Q2: 34 single-family2026 Q2: 8 townhome or condo42Q22026 Q3: 17 single-family2026 Q3: 13 townhome or condo30Q3Single-familyTownhome or condoManufactured

Closings ran flat through 2024 and 2025, apart from spring 2024, then roughly doubled in spring 2026.

Most of these owners bought at the 2022 peak

Las Vegas prices peaked in mid-2022. Very few owners who bought in 2021 show up here, because prices kept rising after they bought. Owners who bought in 2022 make up the biggest group. A surprising number bought in 2023 and 2024 and are already underwater.

When today's short sale sellers bought352 homes with an earlier MLS sale on record, by year of that purchase
Bought 2019 or earlier: 52 homes522019 or earlierBought 2020: 9 homes92020Bought 2021: 7 homes72021Bought 2022: 115 homes1152022Bought 2023: 75 homes752023Bought 2024: 70 homes702024Bought 2025: 24 homes242025Bought near themid-2022 price peak

Homes bought new from a builder or off-market have no MLS sale on record and are not counted here.

Here is each of those homes on one chart. Every dot below the line is an owner selling for less than they paid, before commissions, title and escrow.

Bought at the top, selling below itEach dot is one short sale home bought since 2019. Above the line, the price is higher than what the owner paid. Below it, lower.
-40%-20%0%+20%+40%+60%20192020202120222023202420252022 peakcondo, bought Dec 2024 for $190,000; asking $129,000 (-32%)condo, bought May 2022 for $177,000; asking $130,000 (-27%)condo, bought May 2024 for $216,000; asking $139,900 (-35%)condo, bought Jul 2022 for $225,000; asking $148,500 (-34%)condo, bought Sep 2024 for $195,000; asking $149,000 (-24%)condo, bought Apr 2024 for $210,000; asking $165,000 (-21%)condo, bought Jul 2024 for $245,000; asking $175,000 (-29%)condo, bought Jun 2023 for $200,000; asking $180,000 (-10%)condo, bought May 2022 for $261,000; asking $199,900 (-23%)condo, bought Feb 2024 for $265,000; asking $219,000 (-17%)condo, bought Oct 2022 for $250,000; asking $220,000 (-12%)townhome, bought May 2024 for $225,000; asking $225,000 (+0%)condo, bought Sep 2024 for $250,000; asking $225,000 (-10%)townhome, bought Nov 2024 for $265,000; asking $225,000 (-15%)condo, bought Sep 2022 for $274,000; asking $229,000 (-16%)condo, bought Dec 2020 for $179,000; asking $230,000 (+28%)manufactured, bought Dec 2024 for $249,000; asking $235,000 (-6%)condo, bought Sep 2024 for $267,500; asking $235,000 (-12%)townhome, bought Aug 2022 for $290,000; asking $239,999 (-17%)townhome, bought Jun 2023 for $247,500; asking $240,000 (-3%)townhome, bought Oct 2023 for $267,000; asking $240,000 (-10%)manufactured, bought Jun 2023 for $265,000; asking $250,000 (-6%)single-family, bought Jun 2024 for $333,000; asking $254,888 (-23%)single-family, bought Jun 2022 for $298,000; asking $270,000 (-9%)townhome, bought Jul 2025 for $287,000; asking $275,000 (-4%)single-family, bought Jul 2022 for $475,000; asking $275,000 (-42%)townhome, bought Sep 2022 for $301,000; asking $276,000 (-8%)single-family, bought Jul 2023 for $275,000; asking $279,900 (+2%)single-family, bought Apr 2022 for $331,000; asking $280,000 (-15%)townhome, bought Jan 2024 for $334,990; asking $280,000 (-16%)townhome, bought May 2023 for $290,000; asking $295,000 (+2%)townhome, bought Apr 2024 for $330,000; asking $299,000 (-9%)townhome, bought Mar 2023 for $323,242; asking $299,000 (-7%)townhome, bought Aug 2023 for $366,286; asking $299,000 (-18%)single-family, bought Jul 2019 for $229,900; asking $299,900 (+30%)single-family, bought Oct 2024 for $355,000; asking $299,999 (-15%)townhome, bought Mar 2023 for $325,000; asking $299,999 (-8%)single-family, bought Oct 2022 for $345,000; asking $300,000 (-13%)single-family, bought Oct 2022 for $260,000; asking $300,000 (+15%)single-family, bought Sep 2022 for $315,000; asking $300,000 (-5%)single-family, bought Mar 2025 for $328,000; asking $300,000 (-9%)condo, bought Dec 2024 for $335,000; asking $306,500 (-9%)townhome, bought Mar 2024 for $323,000; asking $307,900 (-5%)single-family, bought Apr 2023 for $290,000; asking $309,999 (+7%)single-family, bought Aug 2023 for $309,000; asking $310,000 (+0%)single-family, bought May 2025 for $340,000; asking $310,000 (-9%)single-family, bought Jul 2024 for $263,000; asking $315,000 (+20%)townhome, bought Jun 2023 for $342,750; asking $315,000 (-8%)townhome, bought Jan 2023 for $352,580; asking $315,000 (-11%)townhome, bought May 2023 for $315,000; asking $317,000 (+1%)single-family, bought Jun 2023 for $329,000; asking $320,000 (-3%)single-family, bought Aug 2025 for $375,000; asking $325,000 (-13%)single-family, bought Aug 2022 for $355,000; asking $325,000 (-8%)single-family, bought Dec 2022 for $384,000; asking $325,000 (-15%)single-family, bought Jun 2022 for $408,000; asking $326,000 (-20%)single-family, bought Jul 2023 for $360,000; asking $329,900 (-8%)single-family, bought Jun 2023 for $365,000; asking $335,000 (-8%)townhome, bought Apr 2024 for $385,000; asking $338,999 (-12%)single-family, bought Oct 2023 for $345,000; asking $340,000 (-1%)single-family, bought Jun 2024 for $350,000; asking $340,000 (-3%)townhome, bought Jun 2023 for $312,000; asking $340,000 (+9%)single-family, bought Jul 2022 for $372,000; asking $345,000 (-7%)townhome, bought Sep 2022 for $392,500; asking $349,900 (-11%)single-family, bought Mar 2023 for $339,900; asking $350,000 (+3%)townhome, bought May 2025 for $349,990; asking $355,000 (+1%)single-family, bought Oct 2023 for $375,000; asking $360,000 (-4%)townhome, bought Feb 2024 for $384,900; asking $365,000 (-5%)single-family, bought Dec 2023 for $415,000; asking $369,900 (-11%)single-family, bought Apr 2022 for $379,000; asking $370,000 (-2%)single-family, bought Apr 2022 for $475,000; asking $370,000 (-22%)townhome, bought Oct 2024 for $399,000; asking $370,000 (-7%)single-family, bought Feb 2025 for $398,000; asking $375,000 (-6%)single-family, bought Sep 2022 for $420,000; asking $375,000 (-11%)single-family, bought Oct 2024 for $388,350; asking $375,000 (-3%)single-family, bought Aug 2022 for $397,000; asking $375,000 (-6%)single-family, bought Oct 2023 for $364,995; asking $380,000 (+4%)single-family, bought Mar 2022 for $360,000; asking $385,000 (+7%)single-family, bought Feb 2023 for $370,000; asking $386,000 (+4%)single-family, bought Jun 2024 for $395,000; asking $395,000 (+0%)single-family, bought Apr 2024 for $439,998; asking $399,900 (-9%)single-family, bought Nov 2025 for $425,000; asking $399,900 (-6%)single-family, bought Nov 2021 for $390,000; asking $399,999 (+3%)single-family, bought Aug 2022 for $465,000; asking $399,999 (-14%)single-family, bought Oct 2019 for $289,900; asking $405,000 (+40%)single-family, bought Jun 2024 for $425,000; asking $405,000 (-5%)single-family, bought Jul 2022 for $485,000; asking $410,000 (-15%)single-family, bought Apr 2025 for $480,000; asking $410,000 (-15%)single-family, bought Jul 2023 for $436,849; asking $415,000 (-5%)single-family, bought Jan 2024 for $410,000; asking $419,900 (+2%)single-family, bought Sep 2022 for $455,000; asking $420,000 (-8%)single-family, bought Dec 2024 for $450,000; asking $429,900 (-4%)single-family, bought Apr 2024 for $451,990; asking $430,000 (-5%)townhome, bought May 2023 for $470,000; asking $435,000 (-7%)single-family, bought Oct 2024 for $445,000; asking $439,000 (-1%)single-family, bought Apr 2024 for $443,000; asking $439,000 (-1%)single-family, bought Jul 2024 for $445,000; asking $439,999 (-1%)single-family, bought Aug 2023 for $430,000; asking $440,000 (+2%)single-family, bought Feb 2025 for $465,000; asking $440,000 (-5%)single-family, bought Aug 2022 for $410,000; asking $449,990 (+10%)single-family, bought Mar 2025 for $540,000; asking $450,000 (-17%)single-family, bought Jul 2024 for $485,000; asking $459,950 (-5%)townhome, bought Sep 2024 for $469,204; asking $460,000 (-2%)single-family, bought Jun 2025 for $530,000; asking $469,000 (-12%)single-family, bought Mar 2023 for $500,000; asking $479,900 (-4%)single-family, bought Mar 2024 for $495,000; asking $480,000 (-3%)single-family, bought Apr 2024 for $560,000; asking $499,000 (-11%)single-family, bought Mar 2022 for $663,300; asking $499,900 (-25%)single-family, bought Nov 2021 for $565,000; asking $499,999 (-12%)single-family, bought Mar 2024 for $499,000; asking $500,000 (+0%)single-family, bought Sep 2024 for $554,950; asking $500,000 (-10%)single-family, bought Jun 2025 for $545,000; asking $539,990 (-1%)single-family, bought Dec 2024 for $549,000; asking $550,000 (+0%)single-family, bought Nov 2023 for $695,989; asking $599,900 (-14%)single-family, bought Jan 2025 for $640,000; asking $600,000 (-6%)single-family, bought Aug 2023 for $665,000; asking $685,000 (+3%)single-family, bought Jun 2025 for $804,990; asking $725,000 (-10%)single-family, bought Nov 2025 for $1,300,000; asking $1,100,000 (-15%)single-family, bought Aug 2024 for $1,400,000; asking $1,479,900 (+6%)single-family, bought Aug 2022 for $2,350,000; asking $1,649,900 (-30%)single-family, bought Jul 2024 for $1,860,000; asking $1,649,900 (-11%)single-family, bought Sep 2023 for $440,000; asking $450,000 (+2%)condo, bought Jan 2024 for $194,999; asking $99,999 (-49%)condo, bought May 2023 for $187,000; asking $150,000 (-20%)condo, bought Feb 2023 for $285,000; asking $209,000 (-27%)townhome, bought Oct 2023 for $268,000; asking $229,000 (-15%)townhome, bought May 2022 for $275,000; asking $250,000 (-9%)townhome, bought Aug 2023 for $240,000; asking $260,000 (+8%)single-family, bought Jun 2022 for $330,000; asking $278,888 (-15%)single-family, bought Jun 2024 for $343,000; asking $295,000 (-14%)townhome, bought Dec 2023 for $306,000; asking $298,000 (-3%)single-family, bought Jun 2022 for $365,000; asking $310,000 (-15%)single-family, bought Jul 2025 for $399,000; asking $350,000 (-12%)condo, bought Aug 2022 for $495,000; asking $350,000 (-29%)townhome, bought May 2024 for $435,000; asking $350,000 (-20%)single-family, bought Sep 2022 for $389,000; asking $359,000 (-8%)townhome, bought Oct 2020 for $279,000; asking $365,000 (+31%)single-family, bought Jan 2024 for $430,000; asking $365,000 (-15%)single-family, bought Nov 2023 for $390,000; asking $395,000 (+1%)single-family, bought Dec 2025 for $414,477; asking $395,000 (-5%)single-family, bought Apr 2022 for $435,000; asking $407,222 (-6%)single-family, bought Feb 2024 for $515,000; asking $499,000 (-3%)single-family, bought Apr 2025 for $810,000; asking $760,000 (-6%)single-family, bought Jun 2022 for $475,000; asking $414,995 (-13%)condo, bought Apr 2022 for $175,000; asking $100,000 (-43%)condo, bought Oct 2024 for $223,397; asking $100,000 (-55%)condo, bought Jun 2023 for $214,000; asking $170,000 (-21%)townhome, bought Mar 2020 for $233,600; asking $180,000 (-23%)condo, bought Aug 2023 for $255,000; asking $189,000 (-26%)townhome, bought Jun 2022 for $225,000; asking $193,000 (-14%)townhome, bought Nov 2022 for $235,000; asking $225,000 (-4%)townhome, bought Sep 2022 for $265,000; asking $225,000 (-15%)single-family, bought Apr 2023 for $364,990; asking $250,000 (-32%)manufactured, bought Jun 2024 for $285,000; asking $265,000 (-7%)condo, bought Sep 2023 for $300,000; asking $266,000 (-11%)townhome, bought Jun 2023 for $305,000; asking $279,000 (-9%)townhome, bought Jul 2019 for $240,500; asking $285,000 (+19%)single-family, bought Jul 2024 for $375,000; asking $300,000 (-20%)townhome, bought Jun 2024 for $348,000; asking $300,000 (-14%)townhome, bought Apr 2024 for $383,000; asking $300,000 (-22%)single-family, bought Oct 2024 for $317,000; asking $310,000 (-2%)single-family, bought Jul 2022 for $412,500; asking $319,000 (-23%)single-family, bought Jun 2022 for $385,000; asking $320,000 (-17%)single-family, bought Aug 2024 for $365,000; asking $325,000 (-11%)single-family, bought May 2022 for $360,000; asking $337,500 (-6%)townhome, bought Jun 2023 for $335,000; asking $338,000 (+1%)single-family, bought Apr 2022 for $392,500; asking $339,000 (-14%)single-family, bought Apr 2023 for $360,000; asking $344,000 (-4%)townhome, bought Feb 2022 for $365,000; asking $345,000 (-5%)single-family, bought Nov 2022 for $365,000; asking $349,999 (-4%)townhome, bought May 2025 for $424,000; asking $375,000 (-12%)townhome, bought Nov 2022 for $396,000; asking $375,000 (-5%)single-family, bought Mar 2022 for $435,000; asking $379,999 (-13%)single-family, bought Sep 2023 for $380,000; asking $382,000 (+1%)single-family, bought Apr 2022 for $445,000; asking $385,000 (-13%)townhome, bought Oct 2022 for $425,000; asking $400,000 (-6%)single-family, bought Aug 2022 for $480,000; asking $405,000 (-16%)single-family, bought Mar 2025 for $485,000; asking $449,800 (-7%)single-family, bought Aug 2025 for $450,000; asking $450,000 (+0%)single-family, bought Apr 2022 for $613,000; asking $485,000 (-21%)single-family, bought Apr 2021 for $422,000; asking $489,999 (+16%)single-family, bought Sep 2024 for $529,900; asking $505,000 (-5%)single-family, bought Apr 2022 for $600,000; asking $599,900 (-0%)manufactured, bought Aug 2022 for $165,000; sold $106,000 (-36%)condo, bought Oct 2023 for $195,000; sold $160,000 (-18%)single-family, bought Mar 2019 for $139,988; sold $172,000 (+23%)condo, bought Mar 2023 for $195,000; sold $185,000 (-5%)townhome, bought Feb 2022 for $285,000; sold $208,000 (-27%)condo, bought Apr 2022 for $298,000; sold $210,000 (-30%)condo, bought Apr 2019 for $175,000; sold $220,000 (+26%)manufactured, bought Nov 2022 for $280,000; sold $260,000 (-7%)townhome, bought Sep 2022 for $270,000; sold $280,000 (+4%)townhome, bought Oct 2022 for $295,000; sold $285,000 (-3%)single-family, bought Jul 2022 for $325,000; sold $285,000 (-12%)single-family, bought Feb 2019 for $225,000; sold $290,000 (+29%)single-family, bought May 2019 for $260,000; sold $295,000 (+13%)single-family, bought Jan 2023 for $353,000; sold $295,000 (-16%)single-family, bought Aug 2022 for $290,000; sold $300,000 (+3%)manufactured, bought Dec 2022 for $285,000; sold $300,000 (+5%)single-family, bought Sep 2022 for $330,000; sold $301,000 (-9%)single-family, bought May 2023 for $320,000; sold $305,000 (-5%)townhome, bought Jul 2022 for $345,000; sold $311,850 (-10%)single-family, bought Apr 2022 for $335,000; sold $317,536 (-5%)townhome, bought Jul 2022 for $380,000; sold $325,000 (-14%)townhome, bought Sep 2022 for $345,000; sold $325,000 (-6%)townhome, bought Mar 2019 for $220,000; sold $329,000 (+50%)single-family, bought Oct 2019 for $202,000; sold $333,000 (+65%)townhome, bought Oct 2023 for $365,990; sold $340,000 (-7%)single-family, bought Jul 2022 for $399,900; sold $350,000 (-12%)townhome, bought Jun 2022 for $388,000; sold $350,000 (-10%)single-family, bought Apr 2022 for $400,000; sold $364,800 (-9%)single-family, bought Jul 2022 for $425,000; sold $365,000 (-14%)single-family, bought Jan 2022 for $360,000; sold $365,000 (+1%)single-family, bought Dec 2022 for $395,000; sold $375,000 (-5%)single-family, bought Sep 2022 for $436,000; sold $375,000 (-14%)single-family, bought Jun 2022 for $395,000; sold $380,000 (-4%)single-family, bought Jul 2022 for $395,000; sold $380,000 (-4%)single-family, bought Dec 2020 for $303,000; sold $400,000 (+32%)single-family, bought Feb 2023 for $415,000; sold $400,000 (-4%)single-family, bought Apr 2022 for $475,000; sold $400,000 (-16%)single-family, bought Feb 2022 for $505,297; sold $400,000 (-21%)single-family, bought Aug 2019 for $381,000; sold $405,000 (+6%)single-family, bought Sep 2020 for $288,500; sold $413,000 (+43%)townhome, bought May 2022 for $440,000; sold $415,000 (-6%)single-family, bought Mar 2024 for $430,000; sold $415,000 (-3%)single-family, bought Dec 2021 for $450,000; sold $422,789 (-6%)single-family, bought Feb 2022 for $435,000; sold $425,000 (-2%)single-family, bought Nov 2022 for $425,000; sold $430,000 (+1%)single-family, bought Jul 2020 for $283,000; sold $456,000 (+61%)single-family, bought Nov 2021 for $480,000; sold $475,000 (-1%)single-family, bought Jun 2022 for $580,000; sold $526,000 (-9%)single-family, bought Feb 2022 for $647,250; sold $590,000 (-9%)single-family, bought Feb 2024 for $549,000; sold $600,000 (+9%)single-family, bought Feb 2022 for $649,900; sold $620,000 (-5%)single-family, bought Apr 2022 for $542,500; sold $650,000 (+20%)single-family, bought Apr 2019 for $470,000; sold $710,000 (+51%)single-family, bought Mar 2022 for $1,950,000; sold $1,700,000 (-13%)single-family, bought Aug 2020 for $189,000; sold $310,000 (+64%)condo, bought Mar 2022 for $195,000; sold $141,000 (-28%)condo, bought Jul 2023 for $205,000; sold $143,250 (-30%)condo, bought Apr 2023 for $173,500; sold $150,000 (-14%)condo, bought Dec 2022 for $209,000; sold $194,000 (-7%)condo, bought Sep 2022 for $250,000; sold $210,000 (-16%)townhome, bought Jul 2024 for $300,000; sold $212,000 (-29%)condo, bought Aug 2022 for $246,900; sold $212,500 (-14%)single-family, bought Sep 2023 for $254,000; sold $252,000 (-1%)single-family, bought May 2022 for $310,000; sold $262,000 (-15%)condo, bought Apr 2025 for $350,000; sold $275,000 (-21%)townhome, bought Aug 2023 for $287,000; sold $275,000 (-4%)townhome, bought Dec 2024 for $321,000; sold $278,500 (-13%)townhome, bought Nov 2023 for $310,000; sold $299,900 (-3%)townhome, bought Oct 2022 for $369,973; sold $300,000 (-19%)townhome, bought Nov 2023 for $328,680; sold $300,000 (-9%)single-family, bought Feb 2024 for $310,000; sold $305,000 (-2%)single-family, bought Nov 2022 for $315,000; sold $309,000 (-2%)townhome, bought Nov 2021 for $292,000; sold $315,000 (+8%)single-family, bought Mar 2022 for $351,500; sold $316,000 (-10%)single-family, bought Apr 2023 for $340,000; sold $319,000 (-6%)townhome, bought Jul 2022 for $359,000; sold $320,000 (-11%)single-family, bought May 2019 for $279,500; sold $323,000 (+16%)townhome, bought Apr 2022 for $368,000; sold $325,000 (-12%)townhome, bought Jul 2023 for $36,000; sold $325,000 (+803%)single-family, bought Feb 2022 for $322,000; sold $326,000 (+1%)single-family, bought Jul 2022 for $420,000; sold $329,000 (-22%)townhome, bought Jun 2022 for $375,000; sold $329,000 (-12%)townhome, bought Jul 2022 for $357,608; sold $329,900 (-8%)single-family, bought Jun 2025 for $342,000; sold $330,000 (-4%)single-family, bought Mar 2023 for $360,000; sold $338,000 (-6%)single-family, bought Sep 2022 for $378,000; sold $350,000 (-7%)single-family, bought Feb 2024 for $366,000; sold $358,000 (-2%)townhome, bought May 2023 for $360,431; sold $360,000 (-0%)single-family, bought Feb 2023 for $355,000; sold $360,000 (+1%)single-family, bought Aug 2021 for $295,000; sold $366,000 (+24%)single-family, bought Apr 2024 for $409,000; sold $370,000 (-10%)single-family, bought Sep 2022 for $399,900; sold $370,000 (-7%)single-family, bought Sep 2023 for $395,000; sold $370,000 (-6%)single-family, bought Sep 2022 for $375,000; sold $370,000 (-1%)townhome, bought Nov 2022 for $435,000; sold $375,000 (-14%)single-family, bought Apr 2022 for $440,000; sold $375,000 (-15%)townhome, bought Apr 2024 for $399,900; sold $375,000 (-6%)single-family, bought Jul 2023 for $388,000; sold $377,000 (-3%)single-family, bought Jul 2022 for $425,000; sold $385,000 (-9%)single-family, bought May 2025 for $415,000; sold $393,000 (-5%)single-family, bought Nov 2023 for $439,000; sold $399,900 (-9%)single-family, bought Mar 2023 for $425,000; sold $402,500 (-5%)single-family, bought Apr 2023 for $454,880; sold $410,000 (-10%)single-family, bought Jul 2023 for $456,084; sold $410,300 (-10%)single-family, bought Jul 2022 for $400,000; sold $412,500 (+3%)single-family, bought Sep 2024 for $505,000; sold $415,000 (-18%)single-family, bought May 2023 for $415,000; sold $415,000 (+0%)single-family, bought Apr 2022 for $460,000; sold $418,000 (-9%)single-family, bought Oct 2023 for $475,000; sold $420,000 (-12%)single-family, bought Mar 2024 for $455,000; sold $420,000 (-8%)single-family, bought May 2024 for $489,000; sold $434,000 (-11%)single-family, bought Apr 2022 for $460,000; sold $435,000 (-5%)single-family, bought May 2020 for $339,000; sold $435,000 (+28%)single-family, bought Sep 2023 for $577,500; sold $436,500 (-24%)single-family, bought Mar 2024 for $465,000; sold $445,000 (-4%)townhome, bought May 2024 for $515,000; sold $455,000 (-12%)single-family, bought Jul 2022 for $533,000; sold $455,750 (-14%)single-family, bought May 2022 for $535,000; sold $460,000 (-14%)single-family, bought Oct 2024 for $539,000; sold $469,500 (-13%)single-family, bought Aug 2022 for $495,000; sold $470,000 (-5%)single-family, bought Oct 2023 for $501,000; sold $472,500 (-6%)single-family, bought Nov 2024 for $559,950; sold $482,000 (-14%)single-family, bought Oct 2024 for $599,999; sold $545,000 (-9%)single-family, bought Jun 2022 for $620,000; sold $552,000 (-11%)single-family, bought Sep 2022 for $750,000; sold $600,000 (-20%)single-family, bought Nov 2022 for $690,000; sold $635,000 (-8%)single-family, bought Feb 2020 for $450,000; sold $695,000 (+54%)single-family, bought Mar 2023 for $1,150,000; sold $950,000 (-17%)single-family, bought Aug 2023 for $1,065,000; sold $950,000 (-11%)condo, bought Jul 2023 for $243,000; sold $207,000 (-15%)Closed: sale price vs. what they paidStill listed: asking price vs. what they paid

247 of the 291 owners who bought in 2021 or later are selling for less than they paid, before 6% to 8% in selling costs. Owners who bought before 2020 mostly have gains on paper; they likely owe more because of a refinance or second loan.

Today’s gap is tens of thousands of dollars

In 2010, Las Vegas short sales routinely came in $200,000 under the loan. Owners who bought in 2021 or later are selling for a median of about 7% to 9% below what they paid, or roughly $30,000 on a typical house. Add 7% to 8% in selling costs and missed payments, and the shortfall is real but much smaller than last time. Condos are the exception, selling a median 16% below purchase price.

That smaller gap means more options. Many owners in this range can catch up, get a modification, or sell close to break-even. Run your own numbers before you decide anything.

How long it takes

A short sale takes about five months from listing to closing. Most of the wait comes after you accept an offer, while the lender reviews it, and that wait has grown every year.

How long a short sale takesMedian days in each stage, for short sales that closed in each year
Listed to accepted offerAccepted offer to closing (lender approval)050100150200 days20242024: 44 days from listing to accepted offer2024: 56 days from accepted offer to closing4456≈100 days20252025: 47 days from listing to accepted offer2025: 68 days from accepted offer to closing4768≈114 days2026 *2026: 71 days from listing to accepted offer2026: 83 days from accepted offer to closing7183≈154 days

* 2026 through October 11. Lender approval is taking about four weeks longer than it did in 2024.

Sale price versus list price

Short sales close at their final list price because the lender has already signed off on that number. The discount happens earlier, through price cuts. Deep discounts were common in 2024 and are rare in 2026, and fewer buyers are paying cash.

Fewer bargains, fewer cash buyersShare of each year's closed short sales
Sold under 95% of list priceBought with cash0%20%40%60%2024: 40% sold under 95% of list40%2024: 49% bought with cash49%20242025: 14% sold under 95% of list14%2025: 36% bought with cash36%20252026: 10% sold under 95% of list10%2026: 24% bought with cash24%2026 *

* 2026 through October 11. Median sale price is 100% of the final list price in every year; the discount comes from price cuts before the sale.

Where the investors went

When a short sale sells well under list to a cash buyer, the house usually comes right back on the market after a renovation. Homes bought with a loan almost never do.

Which short sales came back on the marketShare of closed short sales that were listed for sale again after closing
Cash buyer89 homesCash buyer: 46% put back on the market46%Financed buyer156 homesFinanced buyer: 6% put back on the market6%Sold under 95% of list54 homesSold under 95% of list: 43% put back on the market43%Sold at 95% of list or more191 homesSold at 95% of list or more: 15% put back on the market15%

Cash buyers and deep discounts point to investors. Homes bought with a loan were almost always kept, likely by people who moved in.

What happened to the short sales investors bought26 short sales that were bought, put back on the market and resold since January 2024
Short sale priceResale price after the flip$200K$400K$600K$800K$1000KTownhome · 89121Townhome in 89121: short sale $322,048 (2024-07), resold $295,000 368 days laterTownhome in 89121: short sale $322,048 (2024-07), resold $295,000 368 days later−$27KHouse · 89074House in 89074: short sale $395,000 (2025-03), resold $400,000 464 days laterHouse in 89074: short sale $395,000 (2025-03), resold $400,000 464 days later+$5KManufactured · 89121Manufactured in 89121: short sale $232,971 (2025-01), resold $290,000 35 days laterManufactured in 89121: short sale $232,971 (2025-01), resold $290,000 35 days later+$57KHouse · 89011House in 89011: short sale $436,500 (2026-01), resold $516,700 36 days laterHouse in 89011: short sale $436,500 (2026-01), resold $516,700 36 days later+$80KHouse · 89103House in 89103: short sale $400,000 (2024-12), resold $495,000 141 days laterHouse in 89103: short sale $400,000 (2024-12), resold $495,000 141 days later+$95KManufactured · 89122Manufactured in 89122: short sale $165,300 (2024-07), resold $261,995 109 days laterManufactured in 89122: short sale $165,300 (2024-07), resold $261,995 109 days later+$97KManufactured · 89122Manufactured in 89122: short sale $106,000 (2025-01), resold $205,000 165 days laterManufactured in 89122: short sale $106,000 (2025-01), resold $205,000 165 days later+$99KManufactured · 89122Manufactured in 89122: short sale $176,000 (2024-11), resold $275,000 113 days laterManufactured in 89122: short sale $176,000 (2024-11), resold $275,000 113 days later+$99KHouse · 89110House in 89110: short sale $266,000 (2024-06), resold $380,000 123 days laterHouse in 89110: short sale $266,000 (2024-06), resold $380,000 123 days later+$114KCondo · 89107Condo in 89107: short sale $210,000 (2024-05), resold $325,000 98 days laterCondo in 89107: short sale $210,000 (2024-05), resold $325,000 98 days later+$115KHouse · 89139House in 89139: short sale $341,000 (2024-08), resold $460,000 89 days laterHouse in 89139: short sale $341,000 (2024-08), resold $460,000 89 days later+$119KHouse · 89104House in 89104: short sale $279,000 (2025-07), resold $402,000 297 days laterHouse in 89104: short sale $279,000 (2025-07), resold $402,000 297 days later+$123KHouse · 89002House in 89002: short sale $295,000 (2024-03), resold $425,000 104 days laterHouse in 89002: short sale $295,000 (2024-03), resold $425,000 104 days later+$130KHouse · 89108House in 89108: short sale $250,000 (2024-06), resold $385,000 108 days laterHouse in 89108: short sale $250,000 (2024-06), resold $385,000 108 days later+$135KHouse · 89129House in 89129: short sale $377,000 (2024-05), resold $515,000 216 days laterHouse in 89129: short sale $377,000 (2024-05), resold $515,000 216 days later+$138KHouse · 89117House in 89117: short sale $350,000 (2024-02), resold $495,000 130 days laterHouse in 89117: short sale $350,000 (2024-02), resold $495,000 130 days later+$145KHouse · 89103House in 89103: short sale $327,750 (2024-11), resold $474,998 100 days laterHouse in 89103: short sale $327,750 (2024-11), resold $474,998 100 days later+$147KHouse · 89101House in 89101: short sale $243,817 (2025-02), resold $400,000 117 days laterHouse in 89101: short sale $243,817 (2025-02), resold $400,000 117 days later+$156KHouse · 89102House in 89102: short sale $232,750 (2024-09), resold $389,000 109 days laterHouse in 89102: short sale $232,750 (2024-09), resold $389,000 109 days later+$156KTownhome · 89121Townhome in 89121: short sale $205,200 (2024-05), resold $362,000 105 days laterTownhome in 89121: short sale $205,200 (2024-05), resold $362,000 105 days later+$157KHouse · 89123House in 89123: short sale $325,000 (2024-03), resold $495,000 169 days laterHouse in 89123: short sale $325,000 (2024-03), resold $495,000 169 days later+$170KTownhome · 89134Townhome in 89134: short sale $370,500 (2024-06), resold $550,000 279 days laterTownhome in 89134: short sale $370,500 (2024-06), resold $550,000 279 days later+$180KHouse · 89106House in 89106: short sale $180,000 (2024-04), resold $405,000 280 days laterHouse in 89106: short sale $180,000 (2024-04), resold $405,000 280 days later+$225KHouse · 89149House in 89149: short sale $405,000 (2024-01), resold $640,000 189 days laterHouse in 89149: short sale $405,000 (2024-01), resold $640,000 189 days later+$235KHouse · 89169House in 89169: short sale $270,000 (2024-02), resold $515,000 238 days laterHouse in 89169: short sale $270,000 (2024-02), resold $515,000 238 days later+$245KHouse · 89052House in 89052: short sale $690,000 (2025-08), resold $980,000 122 days laterHouse in 89052: short sale $690,000 (2025-08), resold $980,000 122 days later+$290K

Median difference: $132,500, a median 122 days after the short sale closed. That is before renovation, holding and selling costs.

Some of that difference paid for the renovation. The rest is the discount the buyer got.

If you’re behind on your payments

We talk through your situation for free, confidentially, with no pressure to sell. Call or text Jeff at 702-510-9625 or Lee Ann at 702-205-9430.

How we put this together

Source: an MLS export of short sale listings in Las Vegas, Henderson and North Las Vegas with status dates from January 2024 through October 11, 2026, plus the MLS listing history for each home. The export covered listings that were active, under contract or sold, so short sales that expired or were withdrawn aren’t counted. “Bought” means the most recent MLS sale before the short sale listing. Homes bought new from a builder or off-market don’t have one. The MLS doesn’t record the original loan type, so these numbers can’t show how many sellers used FHA or low down payment loans.

Based on information from the Las Vegas REALTORS® MLS for January 2024 through October 11, 2026. Information is deemed reliable but not guaranteed. This page is general information, not legal or tax advice. Jeff Mix, Nevada license S.0074457. Lee Ann Mix, Nevada license BS.0143453. The Mix Group at Realty ONE Group.